Imagine, that at a factory, the production is running around the clock. The products are put directly into a storage. The input and output orders are entering randomly. Input is always constant, but output only at daytimes. Because the overall storage content must remain constant, this means, that during the times, when output is done (daytime), on top of the input cycles, relatively more output movements must be performed. Daytime is then the "rush hour" of the storage, because most movements must be done during daytime. In the daytime, the probability of output is double of the input probability. So you could compare this with a game of dice. A third of the dice numbers is painted red, and red would then mean that an input happens. Two thirds of the dice numbers are painted blue, and blue would then mean that an output happens.

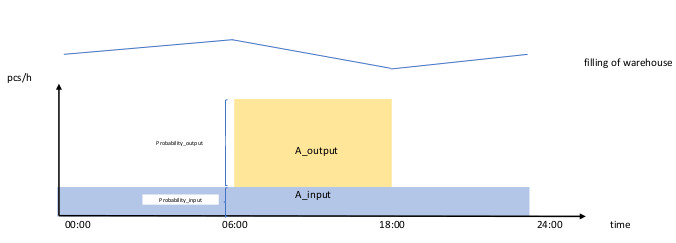
In the picture the top zig-zag line indicates the filling of the storage. When the line rises, the storage fills up and when it goes down, the storage is emptied. Because the filling of the storage is slower , the upward inclination is double of the downward inclination. In the lower diagram, the rate of filling as pcs/h is marked on the time axis. The input (blue) to the storage is continuous along the time axis (x), because the factory works around the clock. The y- axis marks the pieces per hour going into the storage. The light red area is the output from the storage during the daytime. So if the storage content is constant over several days, the Area_output (= Output pcs/h times 12 hours) must be equal to the Area_input (Input - pcs/hour times 24 hours). and that means that during day the probability of output (2/3) is double of the probability of input (1/3).
The worker can do 3 different type of movements: 1.) input cycle 2.) output cycle 3.) combined cycle combined means: input an item, and directly after output an item from storage with one movement. The combined cycle is faster than simply adding an input plus an output cycle, because there are less trips involved. (It is basically what a wife tells her husband: "When you go shopping, could you please take out the trash at the same time"). Therefore it is essential to consider the positive effect of the combined cycle to the throughput capacity of the storage. For calculating the possible throughput capacity of a storage, the cycle times of all input, output and combined cycles together are relevant. In the game of throwing a dice above, it would mean, "when do we have a case, that a red number follows after a blue number" and in this case, it would be a "lucky" (or better: a time saving) combination. The question is then, how many of the input and output cycles can be combined, to make use the benefit of the combined cycle as much as possible.
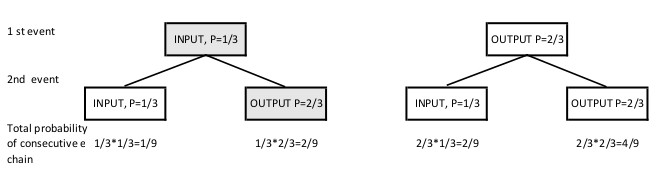
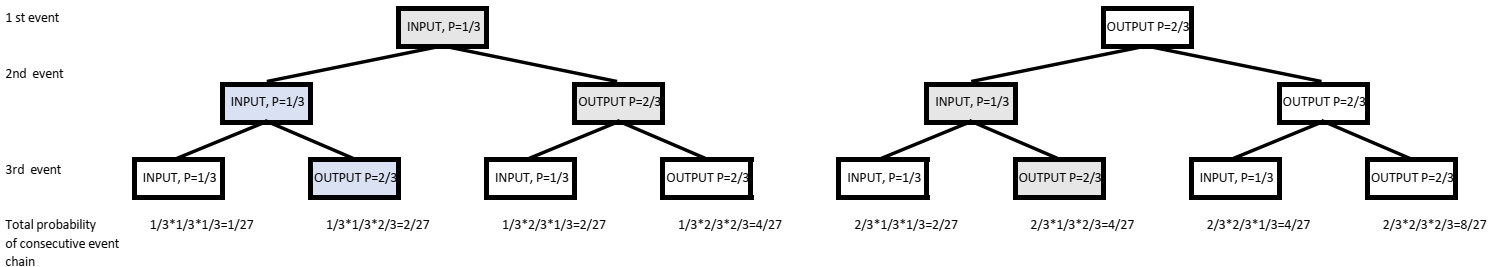
What is the probability, that a worker can do the combined movement? starting from the most simple case, that there are only two consecutive movements. So the first movement can be either input (1/3 probability) or output (2/3 probability). After the first movement, the probability for the next movement is exactly the same (1/3 against 2/3) as before. So there we are with 4 different combinations of movements, and each of this consecutive event chain has a different probability. In the sum, however, the probability sums up to totally 1/9 + 2/9+2/9 + 4/9=1. But this number does not give the combined cycle seperately, and also, in is not accounted for, that the combined cycle has reduced the number of total steps.
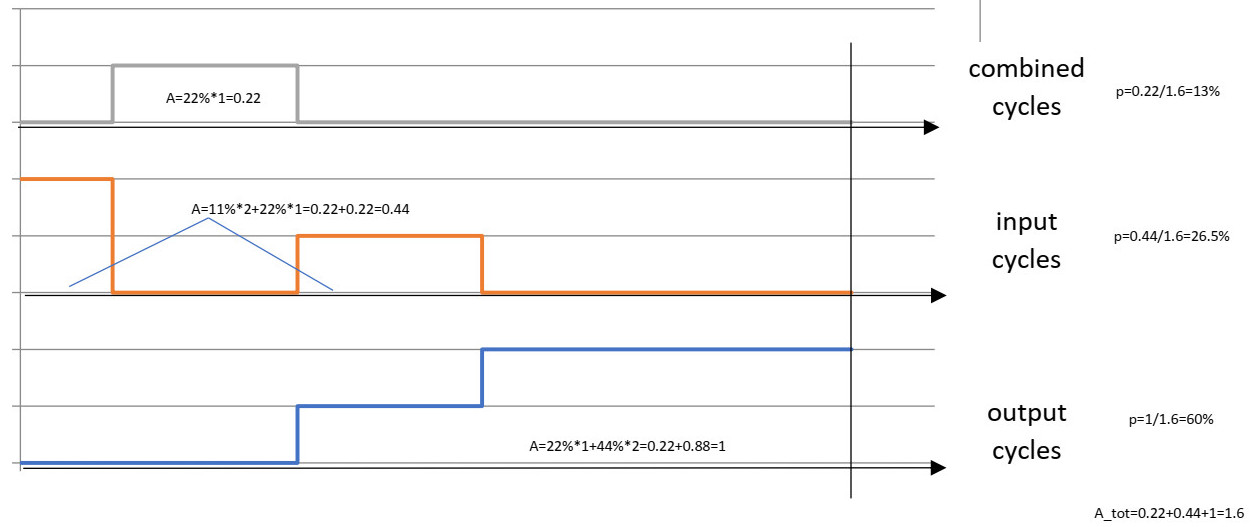
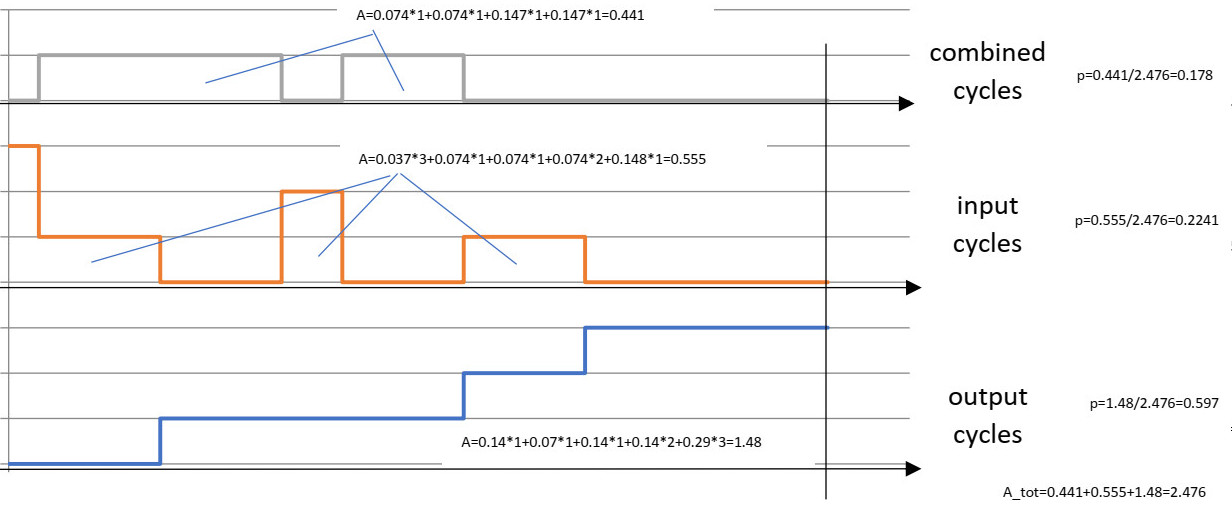
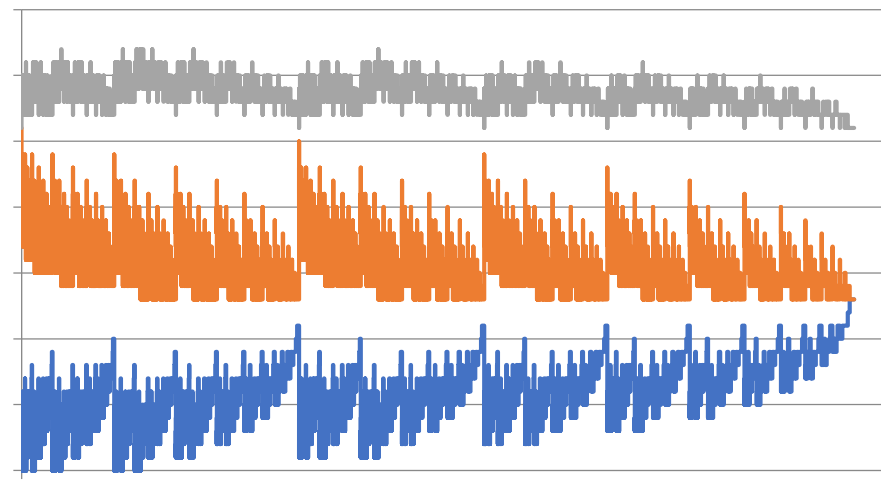
The diagram shows the tree diagram but made in scale, but the x- axis is the portion of the probability of each course of events is made in scale. The lowest blue curve represents the scale of the output movements. So what is shown on the "tree" diagram as the right branch is the course of events with first event as Output (p=2/3) and next an Input(p=1/3) with a total probability of 2/9 = 22%, which is now the first step (Step height is 1, because we talk about one output event) on a stairway curve with totally two steps with an width of the step is 22%. And the outer right-right branch of the upper "tree" curve is the next step of the blue curve, and it has a width of 44% (=2/3*2/3=4/9). And the height of the step is 2, because we have 2 output events. Similarly the red curve shows the probability of the input cycle, but in scale. The steepest part is on the left side, and it represents the outer left branch of the tree scheme above, with a probability of 1/3 * 1/3 = 1/9 (11%), which is then the width of the first step of the downward going light red stairway curve. The height of this step is 2 because it is two input movements together. In the middle is another brick, with a width of 1/3* 2/3= 33% and the height of 1. The top grey curve shows the part of the combined cycle, which is marked in grey colour in the tree diagram. The width (synonymous with probability) is 1/3*2/3 =2/9 =22% and the height is 1, as we are having only one event. If we wouldn't have the "synergy" effect of the combined cycle, the height of this block would have to be 2, but as we have only one movement to do, the height of this block is only 1. The area below each of these 3 different curves represents the probability of the respective event. So the area under output cycle curve is 0.22*1 +0.44*2= 0.22+0.88=1. The area under the input curve is 0.11*2+0.22*1=0.44 and the area under the combined cycle curve is 0.22*1=0.22. The area under all the three curves together must be 1 (100%) as it cannot be more. And the probability of the output cycle is the quotient of area under the output curve with the total area under all three curves. So the area under the output curve was 1 and the area under all curves together is 0.22+0.44+1=1.6, so the relative probability of the output cycle is therefore 1/1.6=0.6 (60% probability of the output cycle) Respectively, the relation of the area under input curve to the total area is 0.44/1.6=0.265 (meaning a probability of 26.5% for the input cycle) And the probability of the combined cycle is 0.2271.6= 0.13 (13%) Totally all probabilities must sum up to 100% = 13.5%+26.5% + 60%= 100%.
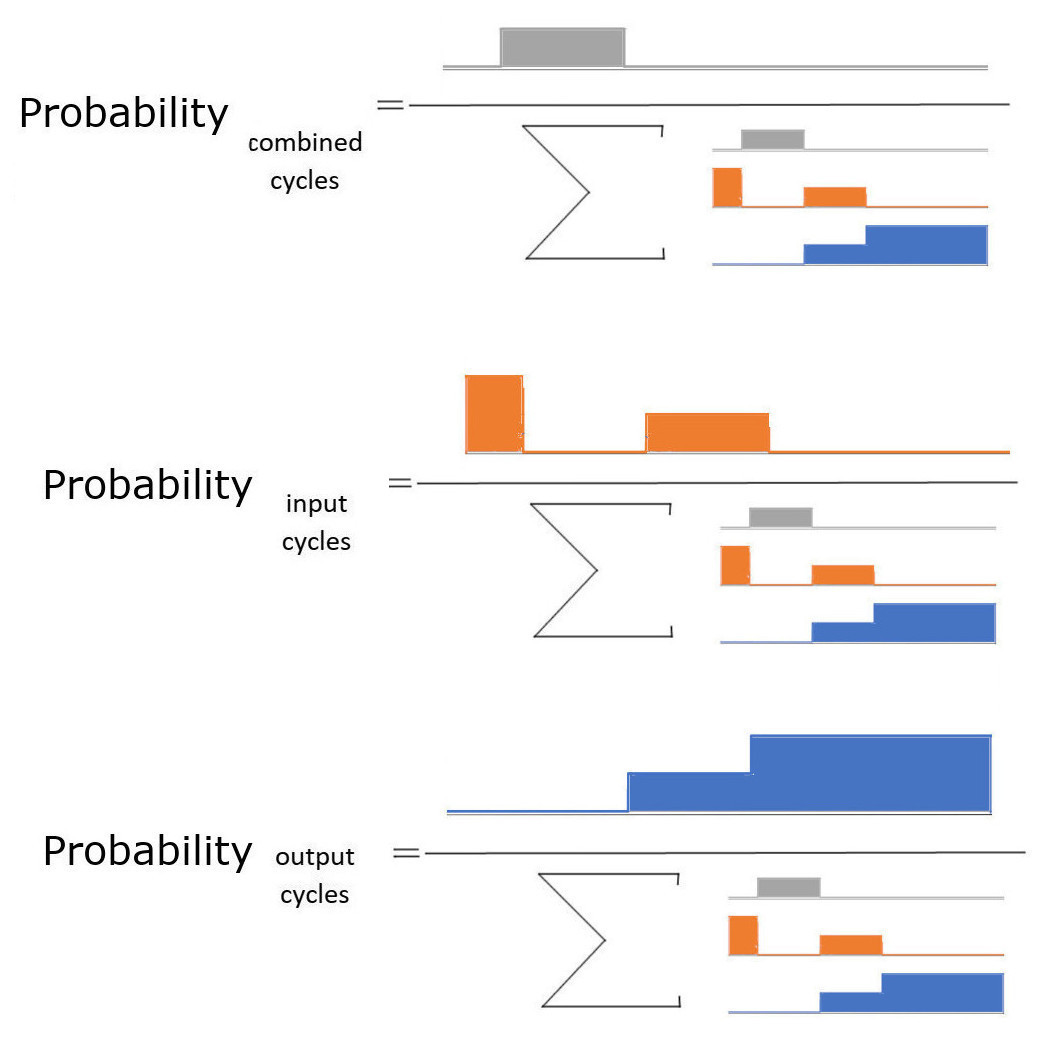
The probability of the different events (combined, input, output) is the area of the respective event divided by the area of all the events together.
The next step in the consideration is to add one step more, so we would have 3 consecutive events. The combined cycle now appears three times in a total amount of eight different possibilities of events. So dependent on the amount of consecutive events, the possibilities are always 2 to the square of event amount. Respectively, the chain of 3 consecutive input events is 1/3*1/3*1/3=1/27 0.037 = 3.7% which is not high number.
So with 3 consecutive events, the probability of combined cycle is 18%, the probability of input cycle is 22% and probability of output cycle is 60% and the sum of all probabilities is of course 100%. We can also see, that our "stairway curve" has got one step more, total three steps, but the combined cycle curve has only one step.
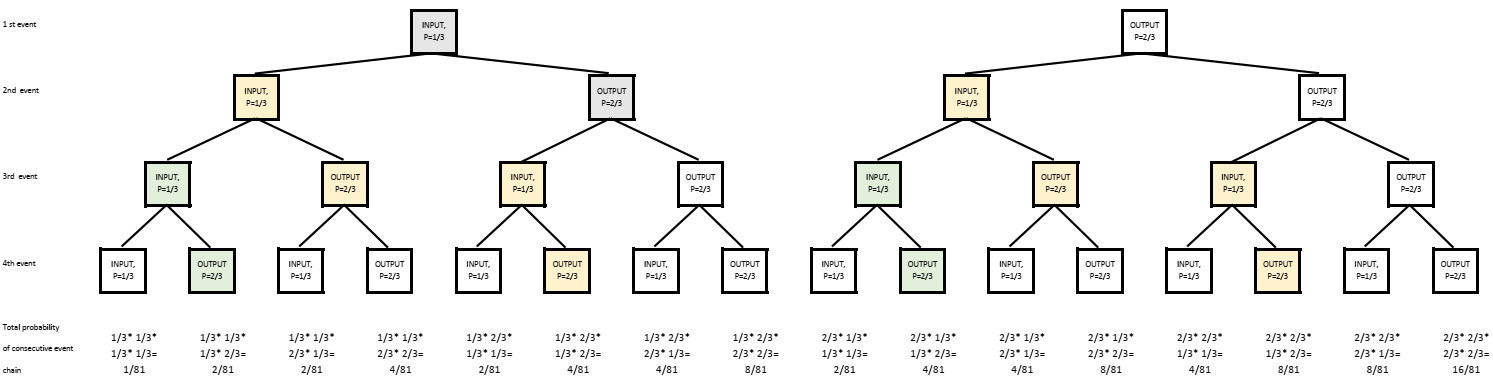
As we have now got routine with this procedure and we get more and more curious, we can continue to make the tree diagram to even four consecutive steps.
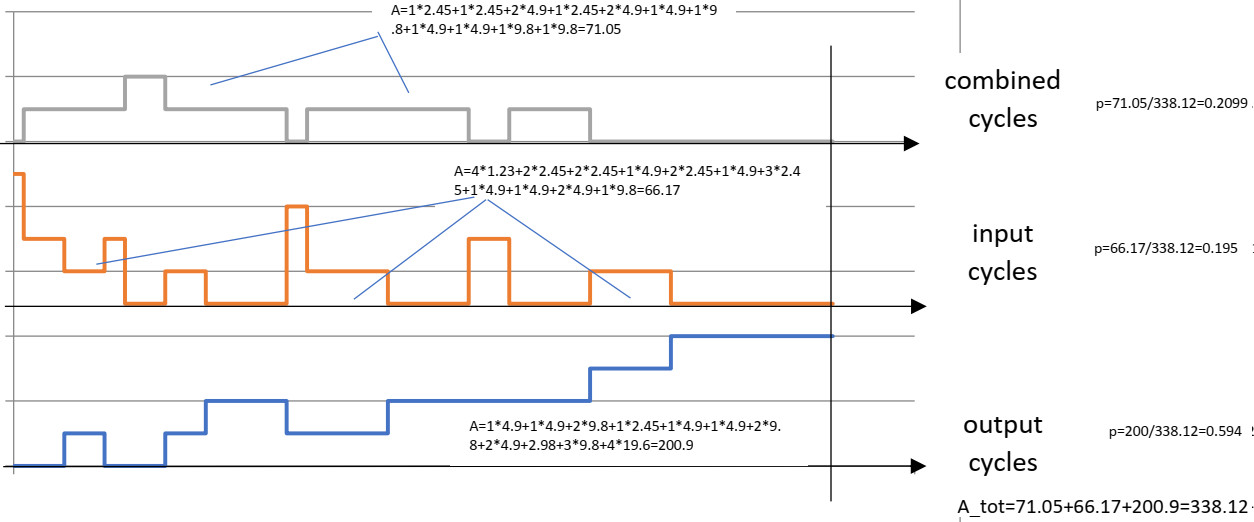
Unfortunately there is a problem with space in the paper width direction, it seems to be impossible to fit even more branches into this tree diagram. But the probability scheme can be continued, although the step widths are getting narrower and narrower. It gives quantitative overview of how many combined cycles can be achieved in comparision to the input and output cycle, as areas under the three different curves are compared.
When continuing to increase the events, the combined cycle probability is approaching 26%, the input cycle probability is 16% and ouptput cycle probability runs to about 58%.
Until now, all thoughts were based on the assumption, that the factory was running 24h / 24h and the output was at daytime 12 hours per day. Another question is, how the situation would look like when the daytime would be 16 hours, which would correspond to a day with three shifts, where two shifts can be used for loading activities. Could it be possible, that, if loading is done even 24 hours per day, that all cycles could maybe done in a combined mode?
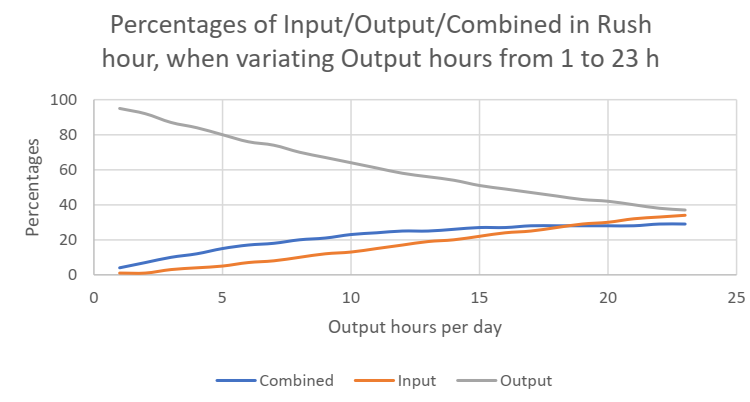
This curve, where the output time during the daytime is variates is a little it theoretical, because it also shows unrealistic situation, that -for instance- when there is only very few output hours per day (let's say 1h only) in means, that during the rush hour almost all of the movements have to be output movements, so no combinations are possible and also input is not possible. But this is a rather unrealistic scenario. On the other extreme end of the curve the proportions the different movements (input, output and combined) are quite even, almost like 1/3 - 1/3 - 1/3. But, unlike expected, the combined cycle can never be completely exploited, obviously because of the stochastic nature of the process, where it cannot be predicted or controlled which one of the different movement will come next.
For calculating the above diagrams, program was used, listing in Python language.